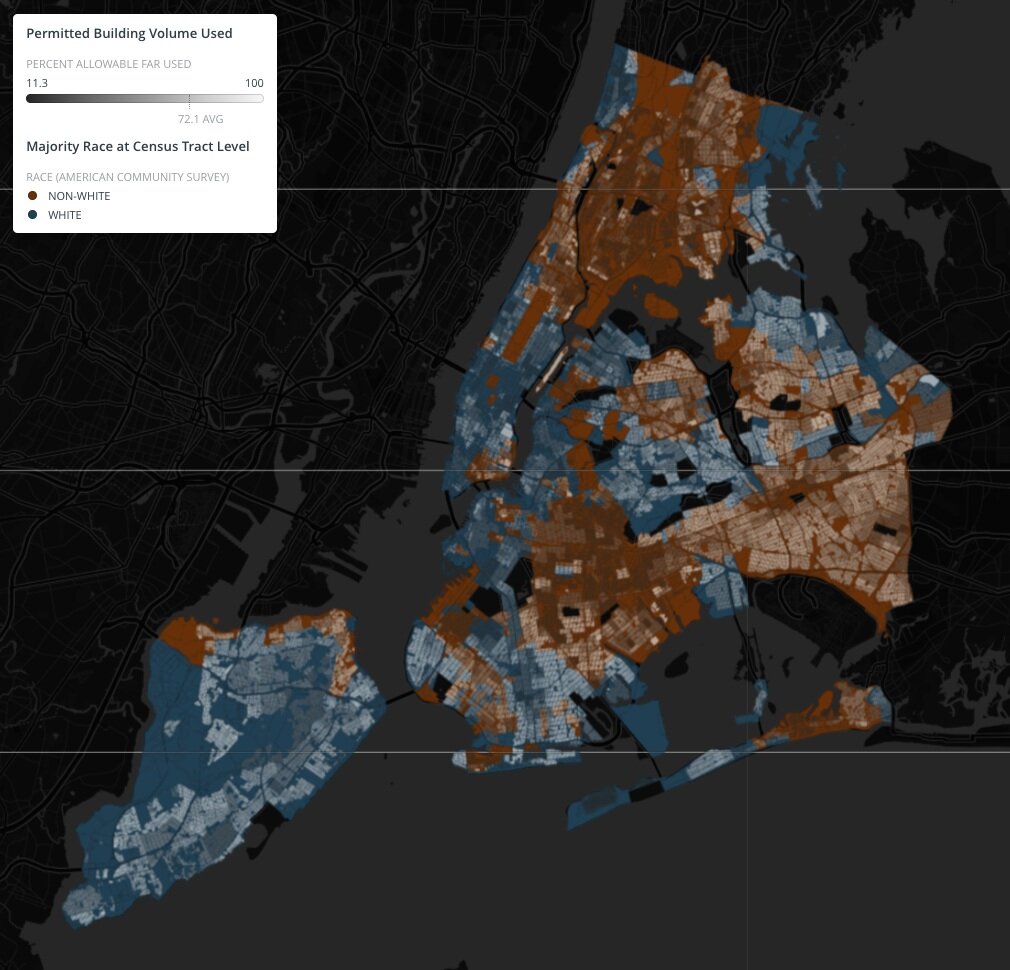
Zoning regulations in New York City may artificially inhibit growth. The neighborhoods being held back are predominantly non-white.
Background
Nobody wants to live in an overbuilt and stuffy city. To prevent this, urban planners regulate the amount that architects can fill their land. They do this using something called the floor area ratio (FAR), a metric that describes how a building’s volume compares to the area of the lot that it is built on. FAR boils down to a simple rule of thumb: to build taller you must built thinner. By putting a limit on the FAR in each lot, urban planners can regulate how densely neighborhoods are packed. In this project, I analyze zoning data to visualize the variation in built density and allowable FAR in New York City. I highlight neighborhoods that have hit their FAR cap despite being sparsely built, and ask why these government-enforced low density areas are almost all predominantly non-white. FAR regulation is supposed to prevent unpleasantly overbuilt neighborhoods, but these areas still have a long way to go before building density is a concern.
Are FAR limits unfairly preventing growth were there is demand?

Methodology
In New York City, FAR limits are applied to each of the city’s ~850,000 tax lots. For this analysis, I pulled zoning and building data on all tax lots, and extracted the ones primarily used for residential purposes. Using the legal definition of FAR and data on building construction, I calculated the FAR of existing residential buildings, and combined this with zoning data to calculate the percent of permitted FAR available. For example, if current buildings in a tax lot have a residential FAR of 1 and the tax lot has a residential limit of 2, we’d know that 50% of the allotted FAR is available for future construction.
I aggregated this data to the census tract level and merged it with public census tract shapefiles to map the FAR statistics. I overlaid this with data on race from the Census Bureau’s American Community Survey.
Results
The lots in the eastern half of Queens are sparsely built in comparison with Brooklyn and Manhattan, yet most non-white neighborhoods in this region have already use a high proportion of their allotted FAR. Are communities in these areas being unfairly held back? Especially given municipal zoning’s deep roots in segregationist history, it is important to interrogate these trends.

FAR of existing buildings
Light areas highlight neighborhoods where existing residential buildings are very dense. Dark areas highlight areas where they are more sparse.
Percent of maximum residential FAR used by existing buildings
Light areas highlight neighborhoods where there is very little FAR remaining for future buildings. Dark areas highlight areas where the allotted FAR permits more growth.